The importance of effective debugging techniques
In this blogpost, I will give a few tips which I hope will help improve your Javascript-debugging techniques, and by doing so, save you hours or even weeks in the long run!
If you’re an experienced web developer, you’re probably familiar with most of these tips already; in that case, you can just skim through and see if there is anything new for you.
For the rest of you, especially front-end developers early in their career or back-end developers wanting to learn more about the front end: I hope these tips help you improve your Javascript debugging skills!

(The infamous red error messages that pop up every now and then during development — and sometimes even in production)
Efficiently troubleshoot your JavaScript using Chrome DevTools
Every developer creates bugs. According to the book Code Complete , a developer creates between 25 – 70 bugs per 1000 lines of code on average. So no matter how experienced a developer you are, you will create bugs, everyone does – and they often pop-up in the most unexpected ways.
It is therefore essential for every developer to understand how to track down, investigate and debug issues in their code. Proper debugging tools & techniques help you find the root cause of a bug or problem so that you can fix it properly and efficiently (and more importantly, it can help you spot issues before a user or customer does!).
It’s time to stop the guesswork, stop console.logging, and stop the endless trial and errors. Let’s see how we can use a consistent and systematic approach to javascript debugging. For these tips, we will use the DevTools of Google Chrome, and I assume that you are familiar with the sources panel of the DevTools.
Step 0: Reproduce the bug
I know, easier said than done! But it’s true: finding a series of actions that consistently reproduces a bug is always the first step to debugging. The steps below will make it easier to track down and inspect issues in a Javascript application.
Don’t forget: if an issue was reported by an external party (such as a customer or other user) it is crucial that you understand the issue that you are about to debug. Make sure you get as much contextual information about the issue as possible!
This information will not always be available to you, but try to get information about what issue was experienced, what steps had been taken to produce the issue and if possible even some screenshots or a video. I might do another post about what a good bug-report looks like, to give an idea of what you should ask for if you have external parties reporting issues/bugs 🙂
1. Pause your code with a breakpoint
A common method for debugging a problem is to insert a lot of console.log() statements into the code, in order to inspect values as the script executes. This is however not very efficient. The console.log() method may get the job done, but breakpoints can get it done faster. A breakpoint lets you pause your code in the middle of its execution and examine all values at that moment in time.
It is possible to use a variety of different breakpoints in the DevTools of Chrome. From the most basic breakpoint (simply making the execution pause on a certain line in your code) to breakpoints when a certain event-listener is triggered (event listener breakpoints) and breakpoints when a DOM node is modified or removed (DOM breakpoints). In this post we will cover a couple of them – beginning with the most basic type of breakpoint: pausing execution on a specific line of code.
You can set a breakpoint in your code, by going to the sources-panel of Chrome and clicking on the line-number where you want to place the breakpoint.
Now, whenever the line of code is executed (for example by reloading the page or by clicking on a button on your page) – the debugger will pause. This is where time stops and the debugging begins. The number of the line where the pause takes place will be highlighted, and you will be able to inspect all accessible values at that point in time.
2. Step through your code
One common cause of bugs is when a script executes in the wrong order. Stepping through your code let’s you walk through your code’s execution, one line at a time, and figure out exactly where it’s executing in a different order than you expected. You can do this when the debugger has paused the execution, after hitting a breakpoint for example. The two main ideas of using this functionality:
- On the Sources panel of DevTools, click Step into next function call
 to step through the execution of your code, one line at a time. If there is a function called on a line, pressing this button will step into that function call – where you can continue to step through the code one line at a time.
 - Click Step over next function call
 to execute a function without stepping into it. You will notice how DevTools does not go into the called function on the line where you pressed this button and instead immediately jumps to the next line in the current function. This can be useful if you do not want to debug the function call on a specific line, but instead want to continue debugging the current function.
That’s the basic idea of stepping through code. Rather than stepping through every line of code, you can use breakpoints to pause the code closer to the probable location of the bug (once you have an idea of where in the code the bug might be).
3. Use the call-stack to find the root-cause of your issue
At some point in time, you will probably run into an issue where the value of some variable is not what you expected, or maybe it even has no value at all! For example, this could be the case when inspecting the value of a parameter that was passed to a function. A cause for this could be that a value was never assigned to the variable, or maybe it was altered along the way by another function in the call-stack. In this case it would be very helpful if we had an easy way to check out each step in the execution sequence that led to the point where our breakpoint is hit.
By traversing the call stack, you can easily backtrack through all of the steps that led up to your current breakpoint, inspecting variables and assignments to verify where the problem originally stemmed from; when time traveling like this, it generally doesn’t take long to find the problematic line!
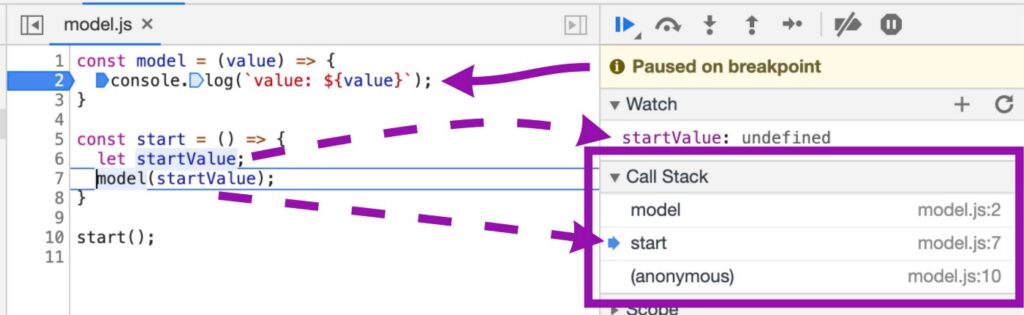
(By traversing the call stack, we are able to inspect variables earlier in the execution. In this case, the debugger has stopped on line 2, but from the call stack, we can move back in time; as you can see, ‘startValue’ never got assigned in the first place.)
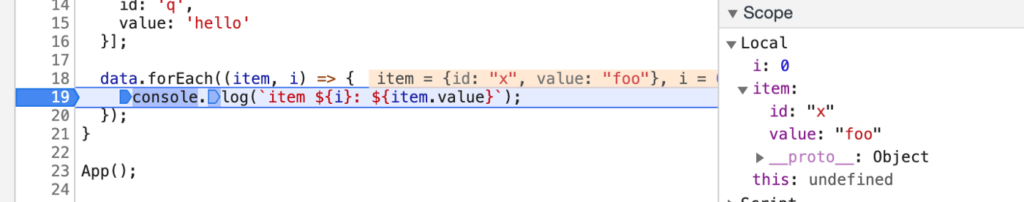
4. Effectively inspect loops with conditional breakpoints
For the sake of this article, I assume that you are already familiar with how to set regular breakpoints in the debugger using Chrome DevTools, so here is a neat trick to improve them: Conditional Breakpoints.
(A regular breakpoint that will stop on every iteration.)
If you have ever tried to debug a for-loop, you will know that it can be quite a long and painful process to get to the right iteration with regular breakpoints. And if the data set you’re iterating over contains a lot of items, it can quickly become near to impossible to get to a specific iteration using regular breakpoints! Without a structured approach, you can be stuck skipping function calls for hours.
A smart tip is here to use a conditional breakpoint. These are a special kind of breakpoints, where you can not only set a position for the breakpoint but also specify a condition and have the debugger stop only when that condition is met (for example on a particular iteration — like when i === 115 ). To convert a regular breakpoint into a conditional one, simply right-click it and select “Edit breakpoint.” Now just enter your desired condition, trigger the breakpoint and watch the debugger pause only when your specified condition is met (for example a specific iteration of a loop). Note: this is not only useful for loops, but can be used to debug any part of your code where you only want the debugger to pause if a certain condition is met!
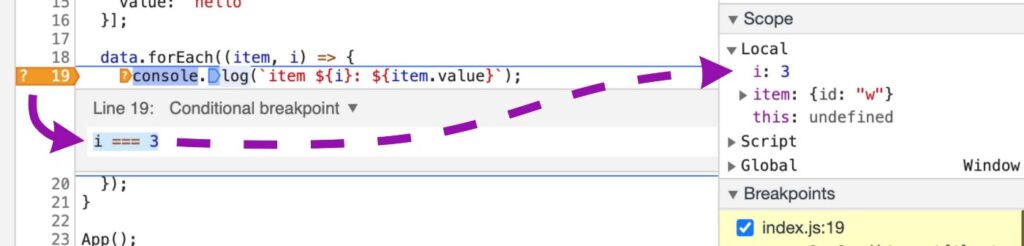
(Conditional breakpoint based on the iterator of a loop — this particular one stopping when i === 3)
5. Pause on all exceptions
In the developer tools of Google Chrome (“DevTools”), you can automatically pause on any JavaScript exception (especially useful for uncaught exceptions). Just enable ‘Pause on exceptions’ within the Sources Panel. Optionally, you can also pause on caught exceptions.
This means the debugger will pause before that red message appears in the Console and you get a chance to inspect what may have gone wrong.
How to use this feature
- In the “Sources” Panel, click the Pause on exceptions button
- Any exception will now pause the debugger to pause, so you can inspect what may have gone wrong
Now, this one is pretty damn useful. If you are banging your head against a wall because it is not making any sense that your code is not throwing an error and is failing silently, this could be your saving grace.
Beware though: enabling this feature will result in all sorts of breakpoints being hit from the nitty gritty of React doing all kinds of witchcraft to some library failing to initialise, but eventually your code will bubble up and you will see that elusive exception waiting for you to inspect and make sense of it all.
6. Use the console
In addition to viewing console.log() messages, you can also use the Console to explore object values and evaluate arbitrary JavaScript statements. In terms of debugging, you can even use the Console to test out potential fixes for bugs.
While the debugger is paused (for example by hitting a breakpoint in your code, or because you enabled “Pause on Exceptions”), you can use the console to execute methods, evaluate any type of arbitrary JavaScript statement and even override values in the current scope.
For example: This way you could set a breakpoint right before a certain function call, and call the function directly from the console with different parameter values to test and evaluate if the function returns the expected result with different parameter values.
Extra
Disable / enable all breakpoints
As an extra, here is a small tip that can be used together with all of the previous ones.
When deep in your debugging session, it’s pretty common to end up with multiple breakpoints scattered throughout your code. If you’re then forced to stop your current session for whatever reason, maybe you want to navigate to a certain page first before activating your breakpoints, instead of removing all of the breakpoints you can simply deactivate them.
Whenever you’re ready to continue your debug session, simply activate the breakpoints again with one click of a button, and pick up right where you left off!
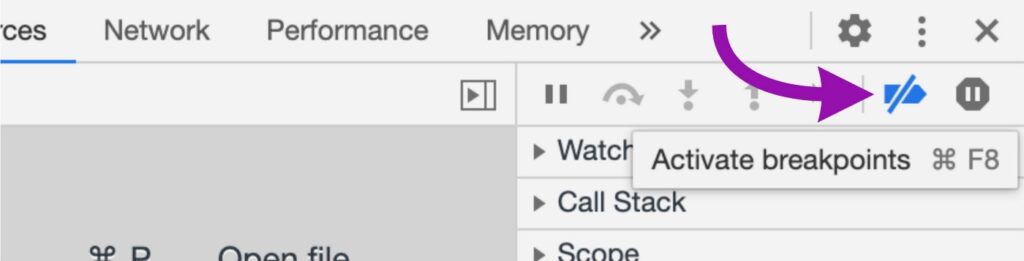
(Activate or deactivate all breakpoints using the “toggle breakpoints” button)
$0, a nice little Chrome developer tools console trick
Another handy tip – one that might be a bit less known: the Chrome Developer Tools console has a nifty shortcut that allows you to select elements from the DOM and access them in the developer console without having to type methods like document.querySelector, document.getElementbyId(), or similar. In the Elements panel of Chrome Developer Tools, you can click on a DOM element and when you do this, “== $0” appears after the DOM element.
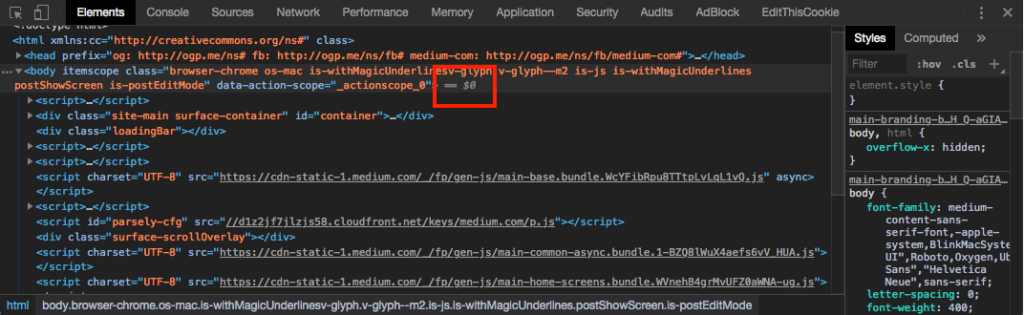
(When clicking on a DOM element, “== $0” appears after it)
When you click on an element in the Elements panel,$0 becomes a variable that you can use in the console to refer to that element. So, you can perform any mutations, read values and attributes or do any operations, just by operating on $0. This can be very handy when needing to inspect or debug DOM elements – and can save you a lot of time by not having to iterate through the DOM manually from the console!
This is perhaps one of the simplest convenience functions provided by the Command Line API of Google Chrome, but there are others. If you want to read more about them – check out the documentation here!